GROWTH TARGET BENCHMARKING
Benchmarking – Is this an issue for NZ Dairy Replacements?*
by Ian Wickham.
Are Dexcel targets too low – or are NZGC targets too high?
This comparison is not simple because NZGC targets are expressed in days of age for each breed and are dependent on the level of rearing (and genetic size) for each animal, whereas the Dexcel targets are an approximation based on an average percentage of mature weight at 6 specified intervals.
NZGC targets have been derived from over 2 million records of over 300,000 heifers in New Zealand during the past 18 years, whereas Dexcel targets were based on calculations made from a incomplete trial based on 10 farms over 4 years in the Cambridge / Te Awamutu area about 10 years ago.
Dexcel targets do not take into account the standard of rearing and assume that all calves reach a 10 week theoretical target and are then compared to a target based on the average mature weight of the animal’s parent stock.
It is quite frustrating to realise that many dairy farmers put more emphasis on low cost rearing methods, rather than ensuring their calves get a good start in life. We are reminded of Dr Jock McMillan’s quote at the Large Herds Conference, Christchurch, 2000 in explaining how he thinks many dairy farmers view their animals feed requirements:
“If a cow is going to be underfed during her life, she may as well learn as a young animal”
In contrast, NZGC view is that:
“It is important to realise the large effect that the first 10 to 12 weeks of calf rearing has on the potential growth of a heifer for at least the next 18 months. If a calf is poorly reared, it will take more than 18 months to recover.”
Evaluation
For this reason NZGC is able to evaluate each animal at the time of first weighing taking into account its breed, weight and date of birth and rank it into one of 5 self-explanatory categories; Budget, Minimum, Standard, Super & Elite.
The next step is to ascertain our client’s expectation for a target to achieve, recognising the limitations imposed by the growth to date.
Because of the wide variation in weights between the main breeds of dairy cattle in NZ, and the increasing number of Cross breed replacements, with the inherent wide variation in ‘genetic mature weight’ NZGC targets and weight monitors each animal individually.
The following 3 Tables show NZGC target weights for each of the 3 main BREEDS- evaluated and compared with DEXCEL breed target. Which Benchmark will you measure against?
| NZGC Growth Chart | 10 weeks weaning | 6 months | 9 months | 15 months mating | 21 months | 24 months calving |
|---|---|---|---|---|---|---|
| Jersey Elite | 91 | 148 | 197 | 276 | 367 | 389 |
| Jersey Super | 84 | 137 | 183 | 258 | 347 | 368 |
| DEXCEL Jersey | 80 | 120 | 160 | 240 | 330 | 360 |
| Jersey standard | 77 | 127 | 170 | 240 | 326 | 348 |
| Jersey Minimum | 70 | 117 | 155 | 225 | 302 | 328 |
| NZGC Growth Chart | 10 weeks weaning | 6 months | 9 months | 15 months mating | 21 months | 24 months calving |
|---|---|---|---|---|---|---|
| JXF Elite | 97 | 166 | 221 | 315 | 422 | 454 |
| JXF Super | 90 | 154 | 206 | 296 | 400 | 431 |
| JXF Standard | 83 | 143 | 190 | 278 | 377 | 408 |
| DEXCEL JXF | 90 | 135 | 180 | 270 | 370 | 405 |
| JXF Minimum | 75 | 132 | 175 | 259 | 355 | 387 |
| NZGC Growth Chart | 10 weeks weaning | 6 months | 9 months | 15 months mating | 21 months | 24 months calving |
|---|---|---|---|---|---|---|
| Fresian Elite | 102 | 184 | 245 | 355 | 477 | 520 |
| Fresian Super | 96 | 172 | 227 | 335 | 477 | 520 |
| Fresian Standard | 89 | 160 | 210 | 315 | 427 | 470 |
| DEXCEL Fresian | 100 | 150 | 200 | 300 | 410 | 450 |
| Fresian Minimum | 81 | 147 | 193 | 293 | 402 | 445 |
| Dexcel Growth Chart | 10 weeks weaning | 6 months | 9 months | 15 months mating | 21 months calving | 24 months calving |
|---|---|---|---|---|---|---|
| % Mature weight | _ | 30 | 40 | 60 | 82 | 90 |
| Jersey-J | 80 | 120 | 160 | 240 | 330 | 360 |
| JXF | 90 | 135 | 180 | 270 | 370 | 405 |
| Fresian-F | 100 | 150 | 200 | 300 | 410 | 450 |
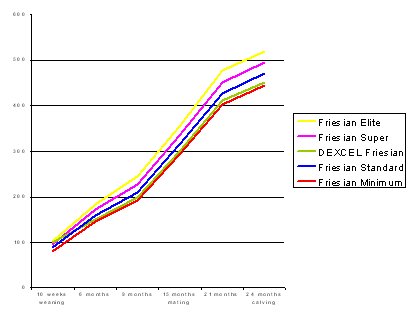
This Chart contains the same data as the previous table and shows the differences in a visual way.
Note: Dexcel targets for Friesian heifers are consistently nearer NZGC ‘Minimum’ except for initial weights.
| Dexcel Targets vs NZGC Actual Weights 2005 | 6 months | 21 months |
|---|---|---|
| Dexcel Jersey | 120 | 330 |
| NZGC Jersey Actual | 134 | 365 |
| Difference | +14 | +35 |
| Dexcel JXK (1st cross) | 135 | 370 |
| NZGC JXF Actual | 150 | 420 |
| Difference | +15 | +50 |
| Dexcel Fresian | 150 | 410 |
| NZGC Fresian Actual | 168 | 466 |
| Difference | +18 | +56 |
How do New Zealand Grazing Company ACTUAL WEIGHTS Compare with DEXCEL Targets?
Most dairy replacements start with NZGC as weaners in the November to January period each year and the balance start about the following 1st May.
We weigh all heifers in the subsequent April, twelve to eighteen months later. This table shows NZGC actual average weights compared to Dexcel targets for the season ended 31st April 2005.
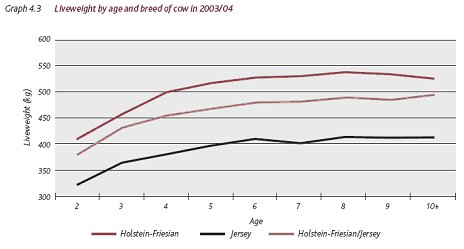
What is the actual weight of NZ dairy cows?
Examine some facts….. Graph 4.3 – reproduced from LIC Dairy Statistics 2003-2004 (Note that Holstein-Friesian/Jersey include 1st and 2nd cross)
Compare a Mature Friesian 8 yrs of age at 540 kg with a 2 yr old at 411 and find the two year old is 76% of Mature weight. Similarly, a Jersey 2 yr cow at 319 kg is 77% of the 8 yr mature Jersey which is 414 kg, and this % is the same for a Crossbreed.
If the LIC Dairy Statistics are representative of the industry, and 90% of mature weight is a realistic target for heifers at herd entry, then it appears on average that – Jersey 2 yr heifers are about 50 kilograms too light & Holstein-Friesian 2 yr heifers are 75 kg too light for best results.
*An article in Dairy Exporter, September 2005, page 100, discusses “Getting the best from heifers” and contains a table of Dexcel Target weights for heifers.
